The Challenge
To design a collaborative mapping platform (MakeYourMaps) that empowers teams. This platform aids sectors ranging from government to education. It allows users to create, share, and manage maps securely. It also supports real-time collaboration, permissions, and data integrations.
Teams were struggling with existing siloed mapping tools that lacked role-based access, analytics, and user-friendly design. This created adoption barriers and slowed decision-making.
Role
Product Manager — led discovery, backlog management, roadmap creation, Agile ceremonies, and stakeholder alignment.
The Process
Conducting Effective Analysis of the Problem
In short: Revenue is concentrated in Enterprise, but future growth depends on addressing dissatisfaction in Govt/Academic and SMB segments through stability + enhanced permissions.
📄 Analysis of Research Data (internal doc)
User Research & Interviews
Interviewed academic teams, government analysts, and enterprise users to identify adoption drivers and frustrations.
Key Findings:
- Real-time collaboration is critical for remote and hybrid teams.
- Academic/government users need strict permission controls.
- SMB/educators value ease-of-use and cost transparency.
- Metrics matter: stakeholders want to measure adoption and usage patterns.
User Personas
Created personas:
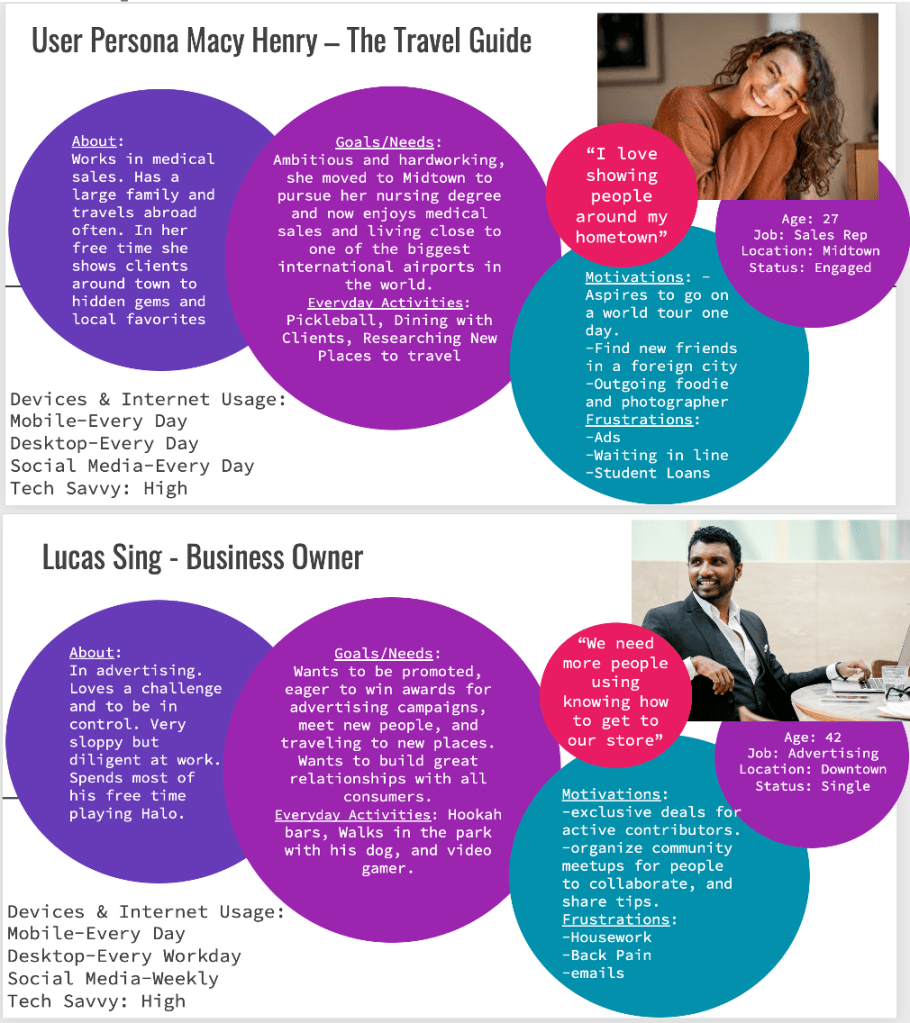
These personas guided feature prioritization and roadmap planning.
Wireframing & Prototyping
- Lo-fi wireframes in pen/paper → Mid-fi in Figma → Interactive prototpe.
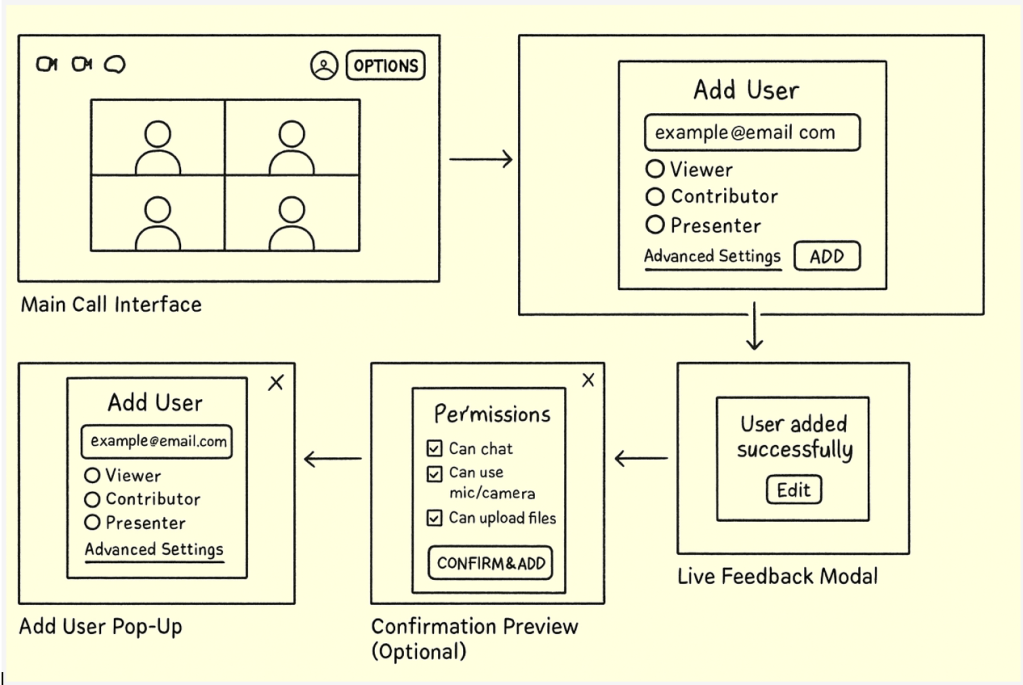
- Iterated based on usability testing with academic and enterprise pilot groups.
- Introduced “role assignment” flow earlier after testing revealed confusion in map sharing.
📄 Prototype (Figma link)
Usability Testing
Participants: 6 (mix of enterprise and academic users).
Scenario Tasks:
- Assign a “Viewer” role and share a project.
- Import CSV data to visualize points on a map.
- Collaborate on edits and review change history.
- Upgrade from free → paid tier when features hit limits.
Findings:
- Permissions must be more visible at onboarding.
- Users loved real-time collaboration but requested undo/version history.
Freemium upsell flow was seen as “natural” if tied to feature caps.
Key Difference in Prototypes
- Prototype A: Original lo-fi version with top-right “+” icon and dropdown menu
- Prototype B: Revised version with a larger button labeled “Add Participants” centered below the participant list, with tooltips and inline permission settings

User Testing Log Template
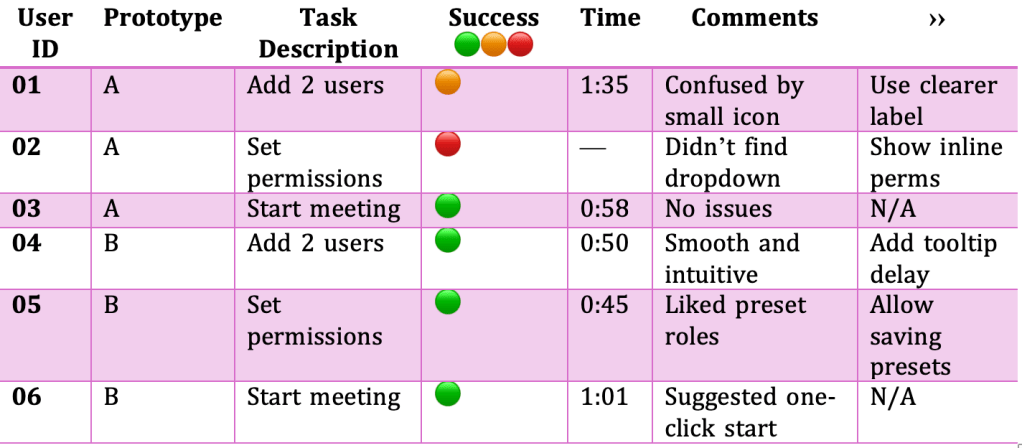
Legend:
🟢 = Completed without help
🟠 = Completed with difficulty
🔴 = Did not complete
💡 = User suggested improvement or had an idea
The Goal
A mapping application is secure, intuitive, and scalable. It balances the needs of enterprises and public-sector organizations. The application remains accessible to SMBs and educators.
Success metrics included:
- Increased adoption in pilot programs (academic + government).
- Higher conversion rates from freemium → paid.
- Positive usability scores around permissions and collaboration.
Primary Stakeholders
- Government analysts
- Educators
- Enterprise data & strategy teams
Project Scale
6 months (initial MVP → pilot rollout).
Tools Used
Figma • Miro • G-Suite • Microsoft Suite
The Conclusion
This project reinforced the importance of Product Management as a bridge between user needs and technical delivery. By combining research insights, validating prototypes, and usability testing, we created a product that addressed compliance requirements while remaining intuitive for non-technical users.
Looking ahead, I’d continue refining analytics dashboards and API integrations to deepen adoption among enterprise users, while keeping the freemium model attractive for educators and SMBs.
